What Are Load Averages?
Linux Load averages indicate the average number of processes that are in a runnable or uninterruptible state. These averages typically show for three different time intervals: one minute, five minutes, and fifteen minutes. This provides a snapshot of the system load over both short and longer periods.
Linux server if you’re just looking at the load averages because depending on how many processors there are, it is going to be drastically different. So, in this case, you want to run the nproc command. This is going to tell you the number of processors available. It’s going to tell you that there are two processors. So, in this instance, this is perfect. If the load average is 1.0, this will be a 50% utilization, and if it’s 2.0, it’s going to be 100% utilization.
Table of Contents
How many command check in load average in linux server?
using uptime
It provides additional system information, such as the current time, number of active users, and load averages.

using top
It shows the system’s performance in real-time, offering a dynamic view. It presents data on CPU usage, memory usage, running processes, and more, enabling users to effectively monitor and analyze system activity.

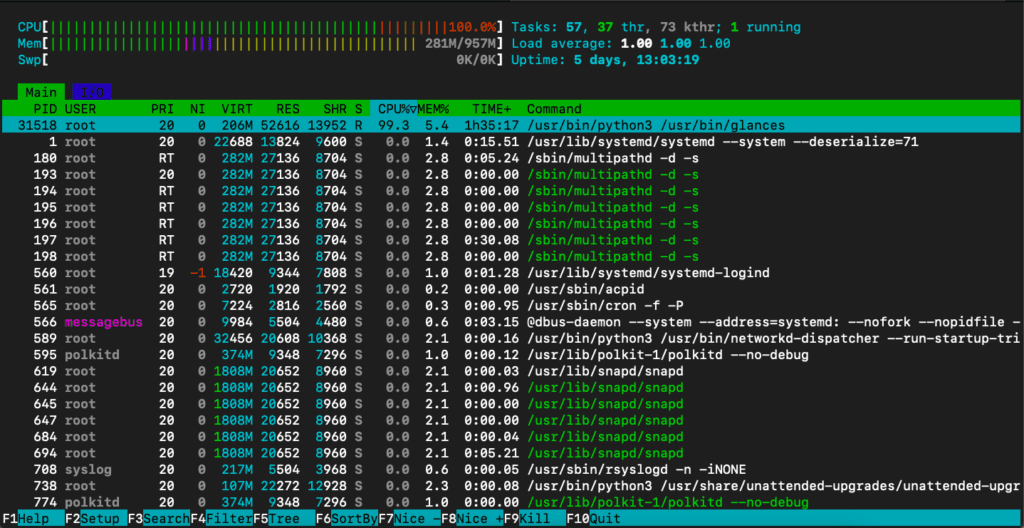
using htop
The htop command-line utility enables you to actively monitor your system’s vital resources or server processes in real-time.
using vmstat
The command retrieves information about memory, system processes, paging, interrupts, block I/O, disk, and CPU scheduling.

using cat /proc/loadavg
This file shows how the load average regarding both the CPU and IO changes over time

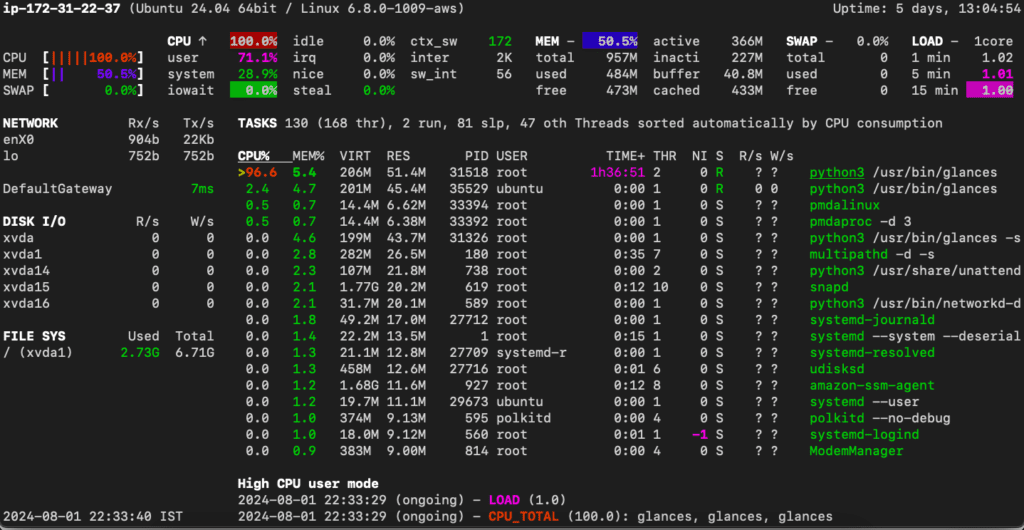
using glances
Glances, an open-source cross-platform monitoring tool, actively allows you to monitor various aspects of your system in real-time, such as CPU, memory, disk, network usage, and more. It also enables you to monitor running processes, logged-in users, temperatures, voltages, fan speeds, and more.
# sudo apt update
# sudo apt install glances
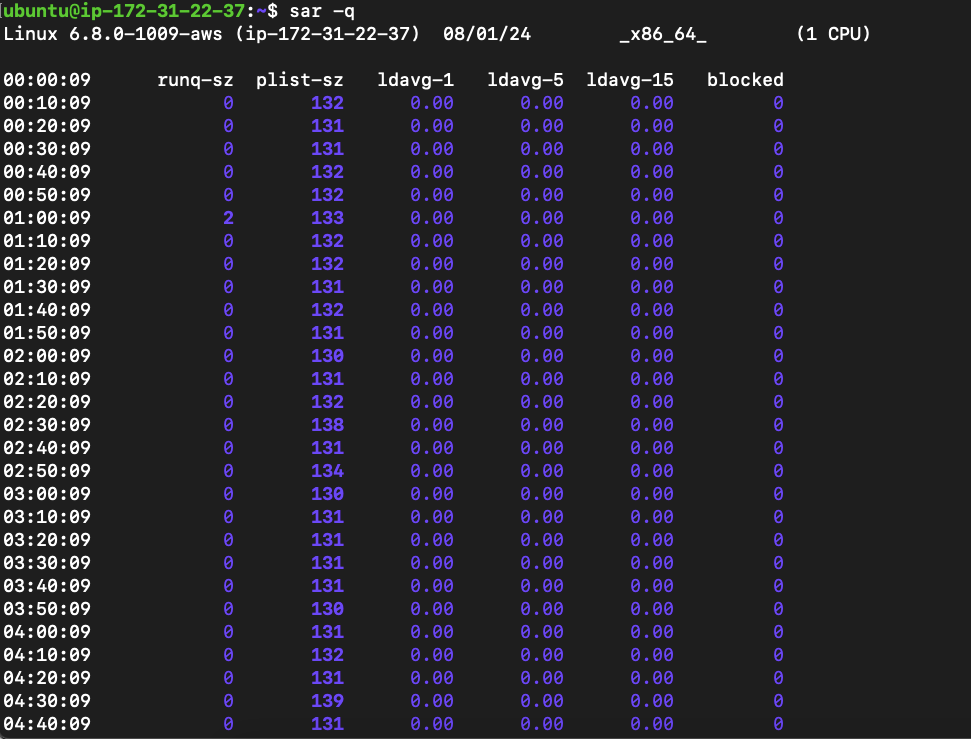
using sar -q
The system collects, reports, and stores system activity information to diagnose performance issues and identify potential bottlenecks. This command provides an overview of various system resources, including CPU, memory, I/O, and network utilization.
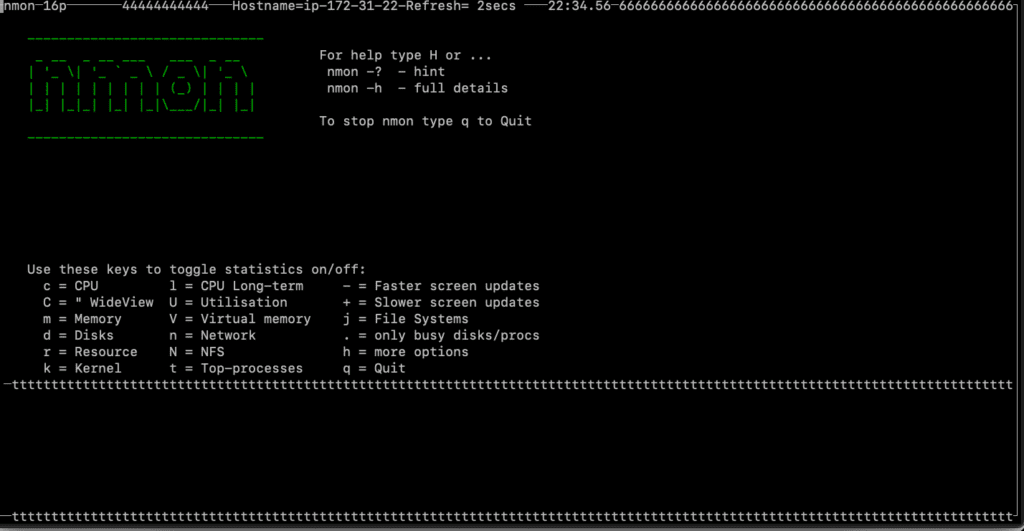
using nmon
The main benefit of nmon is that it enables you to monitor various aspects of your system, such as CPU utilization, memory, disk busy, network utilization, and more, in a single, concise view.
#sudo apt install nmon
using mpstat
The command ‘mpstat’ reports processor-related statistics accurately, displaying information about CPU usage, utilization, and performance. It initializes the processors starting from CPU 0 for the first one, CPU 1 for the second, and so on.

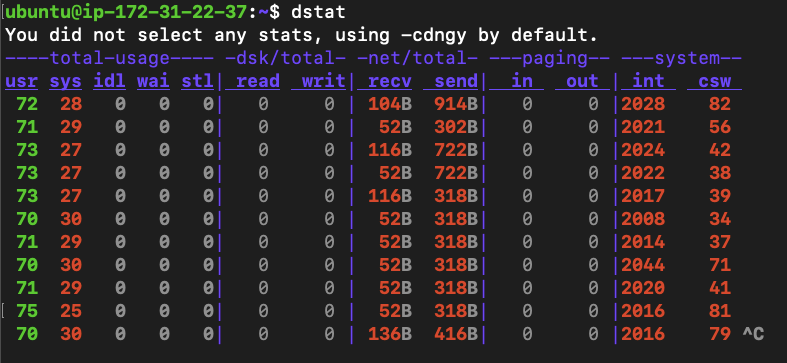
using dstat
dstat is a tool that system administrators use to retrieve information or statistics from components of the system such as network connections, IO devices, or CPU. It is generally used to gather a handful of information about the above-mentioned components of the system.
#sudo apt install dstat
